For many years, I’ve had a Linux box off in the corner that fills a number of useful roles. I used to have something beefier and bigger but it turns out that most of what I really want, I can just do with an Intel NUC.
The most recent re-build of my Linux box had me looking around for what sorts of things people are using in their home-lab / HTPC / etc world and I came upon the entirely nice and useful tool Scrutiny.
However, I’ve already got a Prometheus setup going on my hardware, where most of the stuff is already going. So, for someone’s HTPC or other similar setup, Scrutiny was great, but since it’s mostly serving as a small lightweight monitoring system that’s grabbing the same S.M.A.R.T. metrics as everything else via smartctl, I wanted to get the same things it does well inside of Prometheus.
Timeframe of Linux versions this applies to
I’m using Ubuntu 20.04 LTS. I know that some of the pieces have changed before the 20.04 LTS timeframe and, presumably, this will get better in the future.
smartctl has marked their support for nvme drives as “Experimental” so it reads some, but not all nvme metrics.
Pre-requisites
I’m assuming you’ve already got Prometheus, node_exporter, and Grafana installed.
S.M.A.R.T. metrics, NVMe, and SATA
So that we’re all on the same page, let’s start with hard drive performance metrics.
For quite some time, hard drive manufacturers figured out ways to predict that a hard drive was going to fail imminently and eventually some of them decided to turn that into a product. By the mid 90s, a standard was cooked up called S.M.A.R.T. so that everybody could expose their metrics in a single standard format so that they didn’t need to write all of the bits themselves.
S.M.A.R.T. was built around the only drive you’d commonly encounter at the time: The spinning-rust mechanical hard drive.
Eventually solid-state flash hit a point where you could get a reasonable amount of flash storage for a reasonable amount of money in a reasonable-sized chassis. The first batch of these drives used the same SATA interface as the mechanical drives.
The failure modes, however, were quite different. A mechanical drive has spinning disks and a moving head and this means that your drive has motors and bearings and a sealed dust-free atmosphere. So a lot of the checks were more like noting that the drive took a while to spin up or it was vibrating and the failure was always somewhat random. Conversely, you still have a set of completely random failure modes, but you also have an unambiguous failure mode with flash when it discovers that a block is no longer able to hold data safely. Ergo, a bunch of metrics were added to S.M.A.R.T. to handle flash drives.
However, Flash doesn’t have a lot of the serial read and write requirements that a spinning disk has, so while the previous SATA protocol will work, it’s far from optimal, so now your average high-performance desktop or laptop drive comes on an M.2 stick and uses the NVMe specification over the PCI Express bus, so getting the same information out of it is a bit tricky.
Enter my new NUC. It’s got three drives. I have a bulk-storage mechanical drive connected via USB 3.0. My NUC has a SATA port for a 2.5” laptop-sized drive and a M.2 slot, both of which have drives mounted.
This means that I have three drives and each one works very differently.
Furthermore, at least for the version of smartctl that comes with Ubuntu 20.04, things are not fully integrated, so I have to get one set of metrics with smartctl and a different set with nvme.
Node-exporter text file exporter
As I said above, I’m going to skip over the part where you need node-exporter installed. You also want to configure it so it’s looking for text file exporter files in a directory.
One thing I’ve been, in my professional life, a broken record about is how it’s ridiculously easy to write some quick scripting, using whatever language you desire, to generate scrapeable Prometheus metrics. One way this works out nicely, for long-lived nodes like the NUC in my corner, is that node-exporter has a build-in textfile exporter. This lets you create a cronjob that will write to a textfile in a specific location for node_exporter.
Conveniently, there’s already some workable exporter scripts already provided.
Right now, you end up needing to run two of them. One script, either smartmon.py or smartmon.sh, to monitor S.M.A.R.T. parameters, plus nvme_metrics.sh to monitor the NVMe specific parameters.
The big metrics to watch
Storage manufacturers have a weird idea about S.M.A.R.T. metrics. They don’t always want to tell you what’s important and indicative of failure.
There’s a flag that you have with SMART which indicates that the drive is out-of-specification. That’s the clear indication that the drive is actually out-of-specification and should be replaced. In my experience, at least a chunk of the time, when the drive went from OK to SMART failure, it was already dead. So… not always helpful.
One of the things that endlessly endears Backblaze to me is that, while a lot of folks do their own statistical tracking on their hard drive fleet, Backblaze actually writes a nice set of articles, including one on which SMART stats indicate failure.
There’s one thing that’s not covered there, because most of the Backblaze fleet is spinning disks, which is the remaining write capacity is on the device. My understanding is that when that goes to zero, your device will generally go into read-only mode.
I base most of my logic here back on how Scrutiny works, which matches how BackBlaze views the world.
Prometheus Alerts
Let’s start with the easiest alert:
- alert: SmartDeviceUnhealthy
  annotations:
    message: SMART Device reading unhealthy
  expr: smartmon_device_smart_healthy == 0
  for: 15m
  labels:
    severity: critical
This will alert if any device is marked as unhealthy by SMART, which means that you should consider the device failed.
Note that Prometheus makes this really easy with dimensions. As long as it’s using the smartmon textfile exporter to expose metrics, it’ll get caught.
Now, let’s catch the SMART media wearing out indicator, so it’ll alert when there’s 10% life left:
- alert: SmartMediaWearoutIndicator
  annotations:
    message: SMART device is wearing out
  expr: smartmon_attr_value{name="media_wearout_indicator"} < 10
  for: 15m
  labels:
    severity: critical
Notice here, I am selecting for a name dimesion equal to the wearout indicator.
We can do the same for the NVMe specific metric, except that at least for the NVMe drive I have, it’s giving me an actual threshold for alerting:
- alert: NvmeMediaWearoutIndicator
  annotations:
    message: NVMe device is wearing out
  expr: nvme_available_spare_ratio{} < nvme_available_spare_threshold_ratio{}
  for: 15m
  labels:
    severity: critical
I’m using a neat Prometheus trick here. You notice that I’m relying on the dimensions to make alerting rules easy. Not only will it alert intelligently for a given set of dimensions, it’ll also match them up without me needing to actually write that into the alert.
Also, there’s some fancy features in Prometheus to do predictive alerting, but the lifecycle of a drive is long enough that it’s just added complexity as long as the threshold still gives you some lifespan.
Here’s another neat trick: We want to alert if any of the key metrics are non-zero. They are dimensions in Prometheus, so we can catch them with a single alert using the regex selector:
- alert: SmartKeyMetricsUnhealthy
  annotations:
    message: SMART device has reallocated sectors
    runbook_url: https://www.backblaze.com/blog/what-smart-stats-indicate-hard-drive-failures/
  expr: smartmon_attr_raw_value{name=~"reported_uncorrect|reallocated_sector_ct|command_timeout|current_pending_sector|offline_uncorrectable"} > 0
  for: 15m
  labels:
    severity: critical
The rest of it is just replaying these techniques over and over, so I’ll leave you with the alerting rules as a block:
- alert: SmartDeviceUnhealthy
  annotations:
    message: SMART Device reading unhealthy
  expr: smartmon_device_smart_healthy == 0
  for: 15m
  labels:
    severity: critical
- alert: SmartKeyMetricsUnhealthy
  annotations:
    message: SMART device has reallocated sectors
    runbook_url: https://www.backblaze.com/blog/what-smart-stats-indicate-hard-drive-failures/
  expr: smartmon_attr_raw_value{name=~"reported_uncorrect|reallocated_sector_ct|command_timeout|current_pending_sector|offline_uncorrectable"} > 0
  for: 15m
  labels:
    severity: critical
- alert: SmartMediaWearoutIndicator
  annotations:
    message: SMART device is wearing out
  expr: smartmon_attr_value{name="media_wearout_indicator"} < 10
  for: 15m
  labels:
    severity: critical
- alert: NvmeMediaWearoutIndicator
  annotations:
    message: NVMe device is wearing out
  expr: nvme_available_spare_ratio{} < nvme_available_spare_threshold_ratio{}
  for: 15m
  labels:
    severity: critical
- alert: NvmeCriticalWarning
  annotations:
    message: NVMe has critical warning
  expr: nvme_critical_warning_total != 0
  for: 15m
  labels:
    severity: critical
- alert: NvmeMediaErrors
  annotations:
    message: NVMe has media errors
  expr: nvme_media_errors_total != 0
  for: 15m
  labels:
    severity: critical
- alert: NvmeUsedUp
  annotations:
    message: NVMe shows 90% used
  expr: nvme_percentage_used_ratio{} > 0.9
  for: 15m
  labels:
    severity: critical
Grafana is the rug that ties the room together
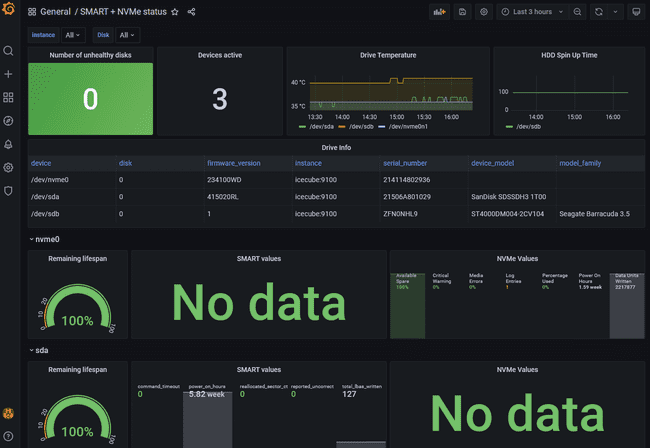
I wasn’t able to find a dashboard plugin that I liked for Grafana so I ended up writing my own.
Put succinctly, no human being should have to look through dashboards on a regular cadence to discover problems. If you care about it, you should put an alert on it.
I view dashboarding as secondary importance behind alerting. Dashboards are really more for convenience, to provide you with all of your necessary supplemental information to make a value judgement instead of requiring you to furiously type in a bunch of queries when an alert goes off.
(Obviously, all authoritative statements like that are inaccurate, but you get the idea)
You can look at the file closely, but I wanted to highlight a few things:
First, the key metric is up top and right: Failed disks. Because that’s what you really want to know most critically.
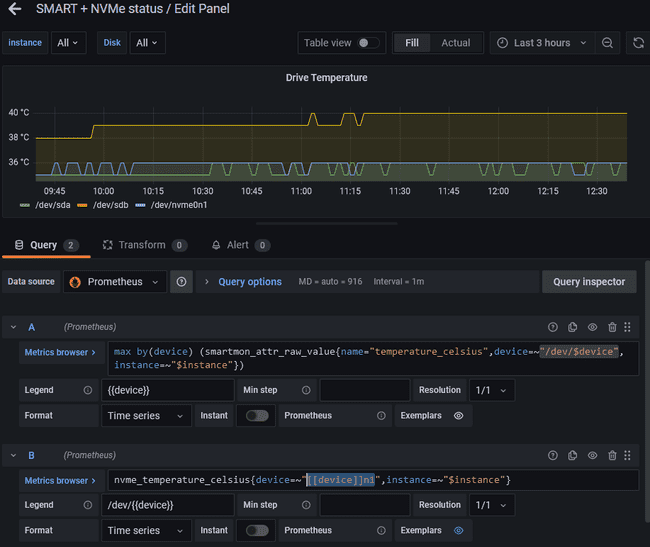
Second, because I’m mashing up the two and they have slightly different ideas of drive names, I created a variable called “Disk” that represents the given device. The query was label_values(smartmon_device_info,device) but then I had to add a regex of \/dev\/(.*) to strip the dev at the front. This then meant that the device query for a smartmon scraped metric would be /dev/$device and for NVMe scraped metric, it would be [[device]]n1. Take, for example, how I set up the graph for drive temperature:
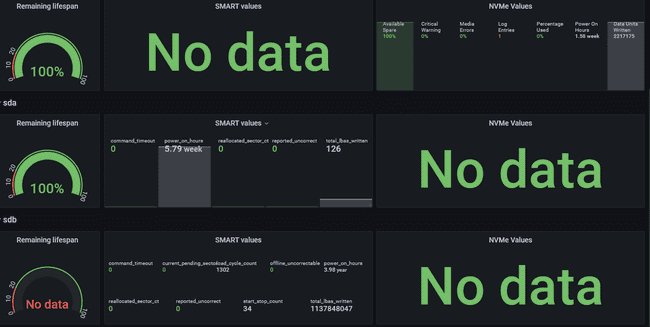
Third, I thought through the friendliest way to show the secondary metrics you’d want to look at and decided I wanted a big box that represented the remaining lifespan as a gauge, and then I created two smaller boxes using the stat panel and then used red/green coloring to denote the things that were indicative of failure whereas the merely informational metrics like the number of power-on hours and blocks written weren’t colored.
Closing thoughts…
As I said above, smartctl has marked their support for nvme drives as “Experimental” I am doing a bunch of extra effort so as to mash up different device properties and it would be nice for them to be more unified… except I also understand that this might be more trouble than it’s worth.
So, this might be somewhat obsolete in the future?
I am pleased to have my NUC better monitored. Obviously if you aren’t setting up your own Prometheus cluster as part of this complete breakfast, Scrutiny might represent a far simpler and friendlier option, but I’m assuming there are at least some folks out there who will benefit.


